Use Cases
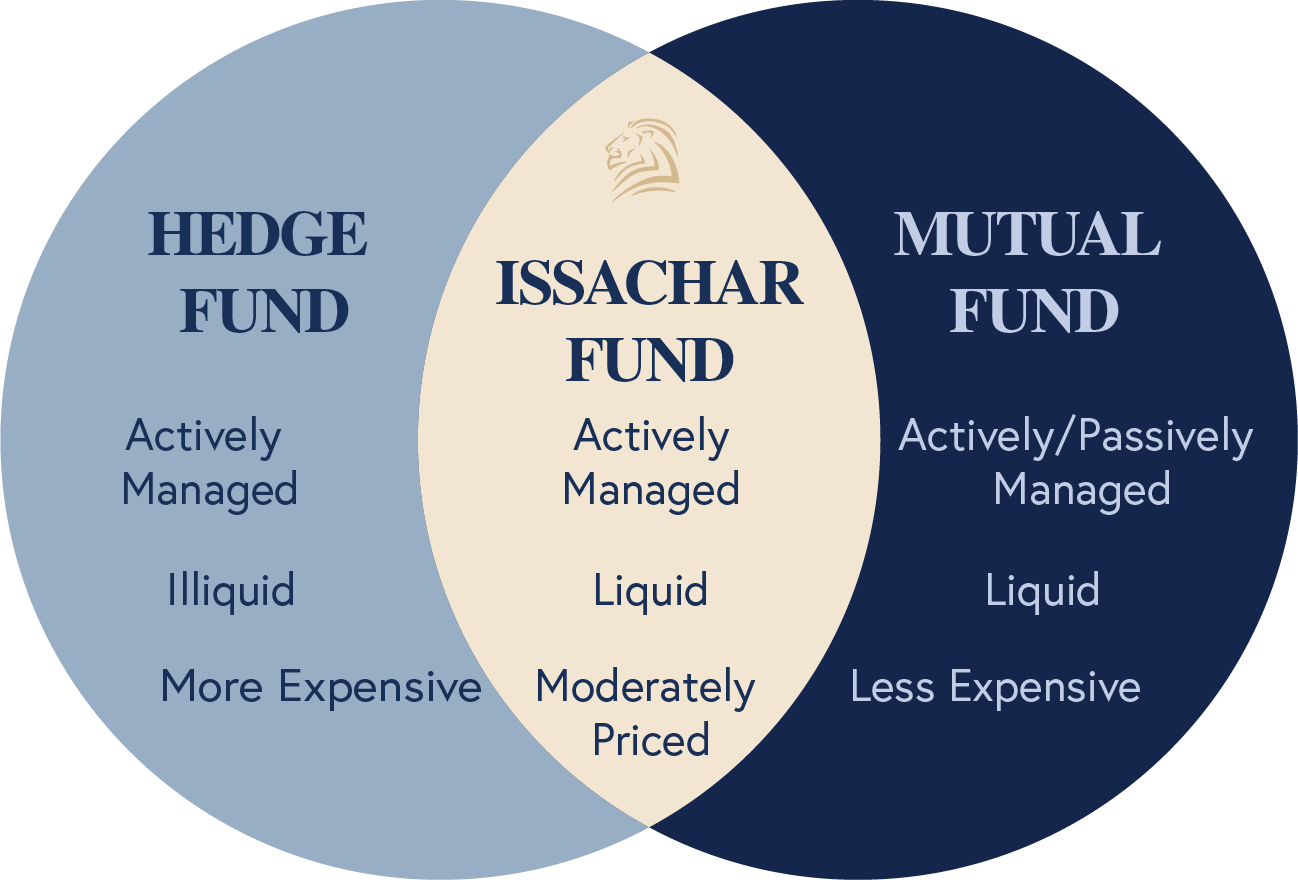
There are three primary ways we see investors incorporating the Issachar Fund, each seeking to accomplish specific portfolio outcomes:
- As a hedge to equity exposure seeking to reduce downside volatility risk;
- As a hedge to fixed income exposure attempting to reduce interest-rate risk; and,
- As a core portfolio holding for conservative investors who are seeking moderate capital appreciation consistent with capital preservation.
Following are three portfolio models for investors to consider, displaying the statistical effect of including Issachar Fund to allocations.
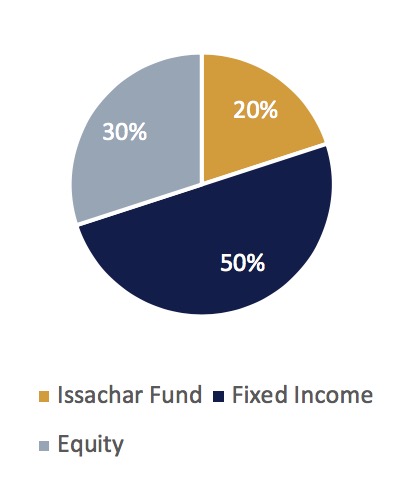
Fixed Income Hedge
Investors concerned about the effect of rising interest rates and desiring to reduce overall sensitivity to interest rate risk may want to consider adding the Issachar Fund as a hedge to their fixed income exposure. Carving out 20% from the fixed income portion of a 50/50 blend portfolio reduced duration and interest rate risk, while maintaining similar overall standard deviation, Sharpe and Sortino ratios.
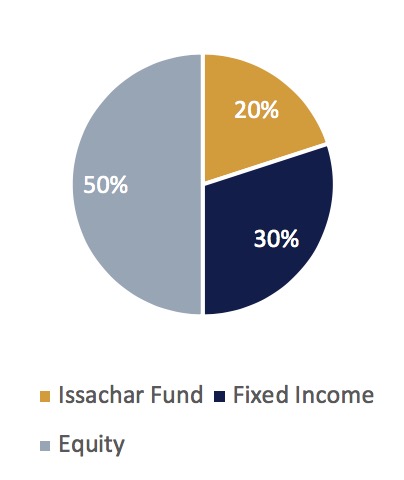
Equity Hedge
Investors seeking to reduce the downside volatility risk associated with a potential decline in the stock market may want to consider including the Issachar Fund as a hedge to their equity exposure. Carving out 20% for Issachar from the equity portion of a 50/50 blend portfolio reduced standard deviation and improve both Sharpe and Sortino Ratios of the portfolio, indicating a statistically improved risk to return optimization.
Core Holding
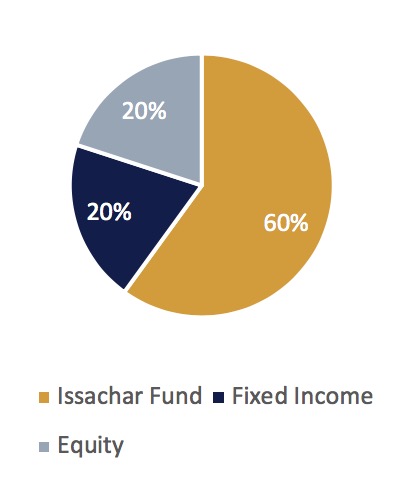
Conservative investors seeking moderate capital appreciation consistent with capital preservation may want to consider utilizing the active risk management approach of the Issachar Fund as a core holding of their portfolio. Establishing Issachar as the primary holding of a portfolio, along with smaller allocations to diversified equity and fixed income holdings, provided investors with lower standard deviation, reduced BETA and improved Sortino Ratio, indicating optimized risk to return portfolio characteristics.
(Data referenced in chart below from inception as of 5/31/2019)
|
(Source: Advisory World as of 5/31/19) |
Standard Deviation | Sharpe Ratio | Sortino Ratio | BETA | R2 |
|---|---|---|---|---|---|
|
Equity Hedge |
4.05% |
0.70 |
1.03 |
0.77 |
0.95 |
|
Fixed Income Hedge |
5.81% |
0.60 |
0.84 |
0.81 |
0.98 |
|
Core Portfolio |
3.77% |
0.50 |
1.05 |
0.41 |
0.52 |
|
50/50 Blended Portfolio |
5.93% |
0.63 |
0.85 |
1 |
1 |
Blended Portfolio: 50/50 blended portfolio comprised of 50% MSCI All Country World Total Return Index (“equity”) and 50% Bloomberg Barclays US Aggregate Bond Index (“fixed income”). Where “fixed income” and “equity” are named in the above model portfolios, these are the indexes being used for statistical purposes. You cannot invest directly in an index. Unmanaged index returns do not reflect any fees, expenses or sales charges. Past performance is no guarantee of future results
An investment in the Issachar Fund contains risks and may not be suitable for all investors.
MSCI All Country World Total Return Index: A market capitalization weighted index designed to provide a broad measure of equity-market performance throughout the world. The MSCI ACWI is maintained by Morgan Stanley Capital International (MSCI) and is comprised of stocks from 23 developed countries and 24 emerging markets
Bloomberg Barclays US Aggregate Bond Index: covers the USD-denominated, investment-grade, fixed-rate, taxable bond market of SEC-registered securities. The index includes bonds from the Treasury, Government-Related, Corporate, MBS (agency fixed-rate and hybrid ARM pass-throughs), ABS, and CMBS sectors. Fix income securities are subject to risks including inflationary and interest rate changes, among others.
Standard Deviation: … Measures the degree of variation of monthly returns around the mean (average) return. The higher the volatility of the investment returns, the higher the standard deviation will be.
Sharpe Ratio: The Sharpe ratio is used to characterize how well the return of an asset compensates the investor for the risk taken, the higher the Sharpe ratio number the better
Sortino Ratio: Measures the risk-adjusted return of an investment asset, portfolio, or strategy. It is a modification of the Sharpe ratio but penalizes only those returns falling below a user-specified target or required rate of return, while the Sharpe ratio penalizes both upside and downside volatility equally.
BETA: Describes how the expected return of a stock or portfolio is correlated to the return of the financial market as a whole. A Beta greater than 1.00 indicates the portfolio is more volatile than the market, and a Beta less than 1.00 indicates the portfolio is less volatile than the market.
R2: Is a measurement of how closely a fund’s performance correlates with the general market. An R-Squared of 1.00 indicates that 100% of the fluctuation in a portfolio’s return is explained by the fluctuation of the market.